IntelliJ Debug Configuration - Debugging Your Scala Application
Overview
In this tutorial, we will review in more detail the debug configurations that are made available in IntelliJ when we debug our Scala applications.
Steps
1. Open IntelliJ and create a new package and Scala object
If you do not have IntelliJ installed or do not know how to create a package or Scala object, feel free to review the previous tutorials.
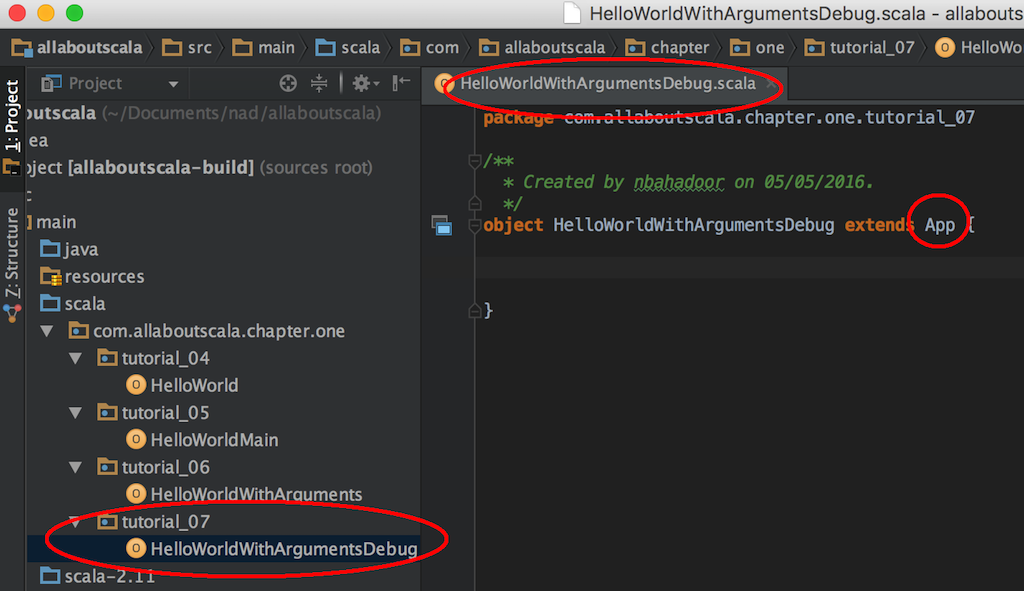
Let us create a package named com.allaboutscala.chapter.one.tutorial_07 and also create a new Scala object named HelloWorldWithArgumentsDebug as follows:
NOTE:
- As explained in the previous tutorials, our HelloWorldWithArgumentsDebug application extends the App trait and as such we do not have to manually write up the main function.
2. Print command line arguments
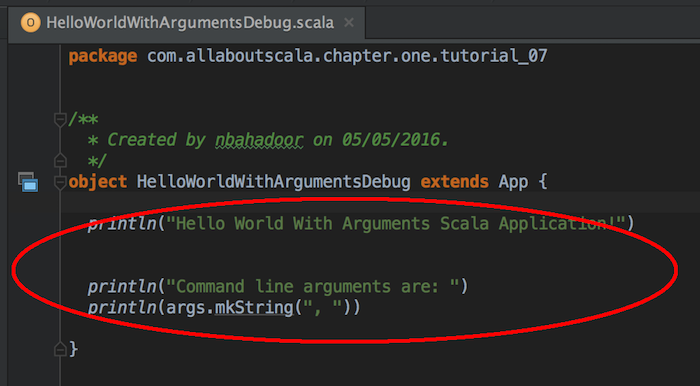
Similar to the previous tutorial, we can add the following print lines to show any command line arguments that are passed in when our Scala application starts:
3. Debug HelloWorldWithArgumentsDebug
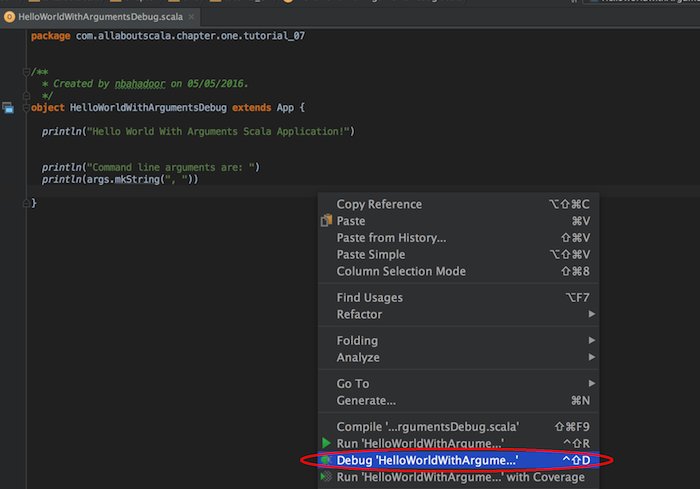
Similar to the previous tutorial, right click anywhere in HelloWorldWithArgumentsDebug but instead of selecting the Run menu item, select Debug HelloWorldWithArgumentsDebug as follows:
In the Console window, we can see our HelloWorldWithArgumentsDebug Scala application ran with the following output:

NOTE:
- Our command line arguments were empty! Well, that's expected since we did not pass any arguments when starting our HelloWorldWithArgumentsDebug Scala application.
4. Add command line arguments to the debug configuration
From IntelliJ's Run menu, select Edit Configurations.
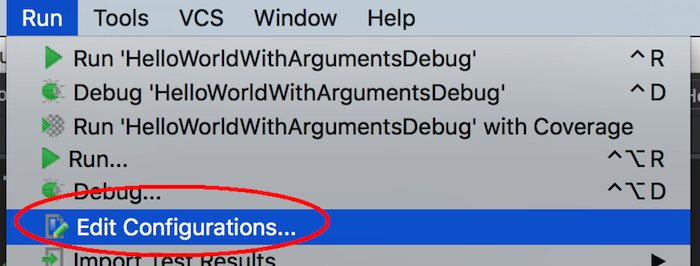
This opens up the Run/Debug Configurations windows. In the program arguments textbox, add firstArgument secondArgument thirdArgument as shown below:
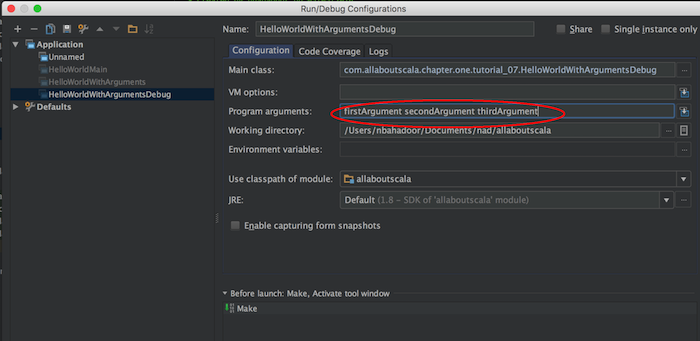
NOTE:
- Our Debug configuration has a name which defaults to the name of our Scala file.
- The Main class textbox has the fully qualified path for our HelloWorldWithArgumentsDebug file. A fully qualified path is simply the full package name where our file resides followed by the file name itself. In our example, it is com.allaboutscala.chapter.one.tutorial_06.HelloWorldWIthArgumentsDebug
- The classpath of module defaults to our allaboutscala project which tells IntelliJ to look for our main class in this specific project.
Next click the OK button to save and close the dialogue.
5. Add breakpoint
Suppose we wanted to debug and pause our application to visually inspect that our command line arguments from Step 4 above were actually contained inside the args argument.
To do this, we add a breakpoint by left click on the sliver to the left hand side of the line where we would like IntelliJ to pause our application:
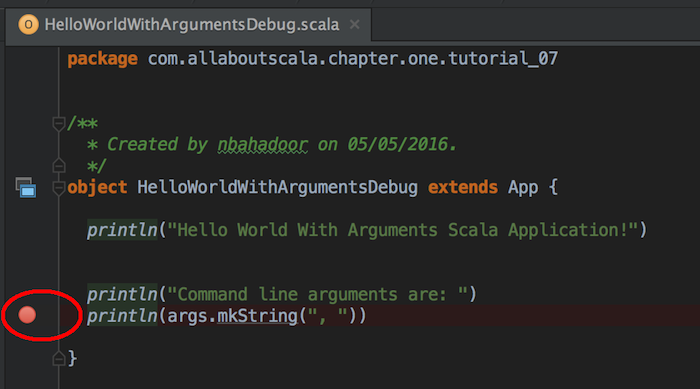
NOTE:
- You should have a red dot as shown above which represents our breakpoint on the line: println(args.mkString(", "))
6. Debug our application
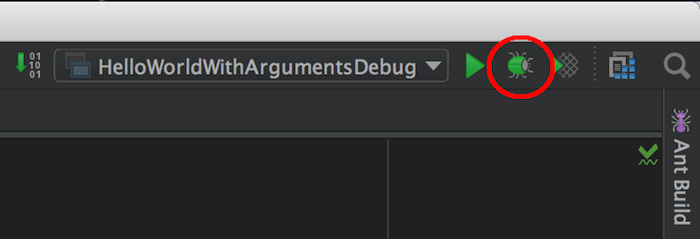
Instead of right click and selecting the Debug menu item, you can click the debug icon on the top right corner in IntelliJ:
You should then see our application starting but it will pause at our breakpoint from Step 5 above:

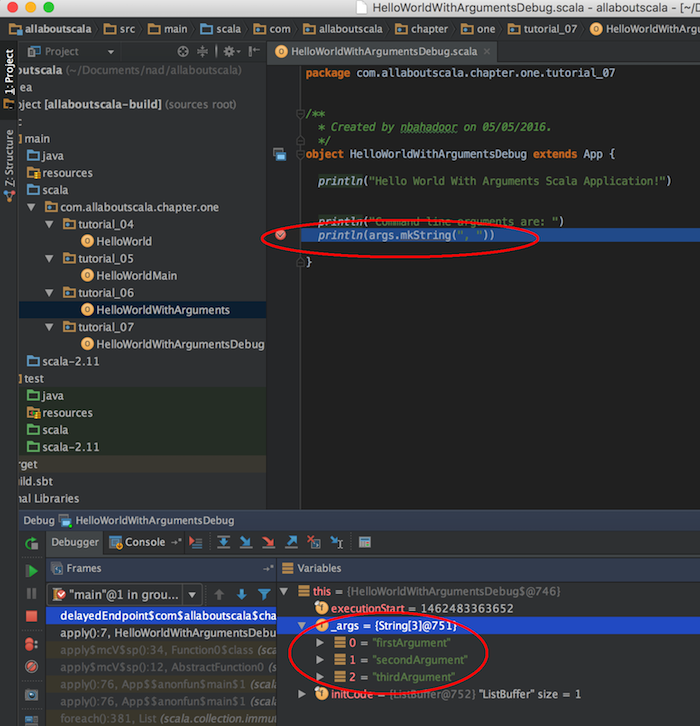
NOTE:
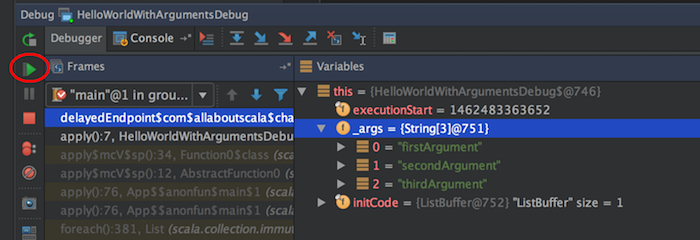
- If you expand the this variable, you would see the _args variable which contains our command line arguments.
- To the left hand side of the variables panel, you will see the call stack for our application.
- To resume our application, simply click on the resume icon as shown below:
This concludes our tutorial on IntelliJ Debug Configuration - Debugging Your Scala Application and I hope you've found it useful!
Stay in touch via Facebook and Twitter for upcoming tutorials.
Don't forget to like and share this page 🙂
Summary
In this article, we went over the following:
- How to print command line arguments.
- How to edit IntelliJ's run configuration.
- How to add command line arguments on start up of a Scala application.
- How to add breakpoint.
- How to debug our Scala application.
Tip
- You should experiment with the debugging window as it will become your best friend when debugging large scale Scala applications.
Source Code
The source code is available on the allaboutscala GitHub repository.
What's Next
In the next tutorial, I will go over the project structure in more detail for Scala applications as shown in IntelliJ.
Share this article on


